

Remittances are financial or in-kind transfers made by migrants directly to families or communities in their countries of origin. The World Bank compiles global data on international remittances, notwithstanding the myriad data gaps, definitional differences and methodological challenges in compiling accurate statistics.
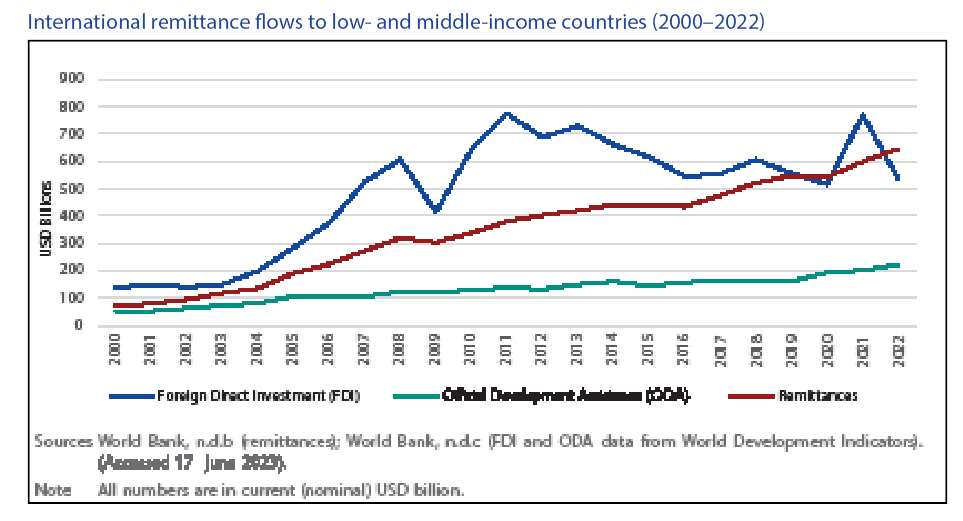
Its data, however, do not capture unrecorded flows through formal or informal channels, and the actual magnitudes of global remittances are therefore likely to be larger than available estimates. This issue came to the fore during the pandemic, following a much more positive outcome in 2020 for international remittance flows, contrary to initial dire projections; this was due in part to a shift from informal channels to formal channels in response to COVID-19 immobility restrictions, among other reasons.25 Despite these issues, available data reflect a long‑term increasing trend in international remittances in recent years, rising from around USD 128 billion in 2000 to USD 831 billion in 2022.
International remittances have recovered from the dip in 2020 due to the COVID-19 pandemic. Migrants sent an estimated USD 831 billion in international remittances globally in 2022, an increase from USD 791 billion in 2021 and significantly more than USD 717 billion in 2020. As in previous years, low- and middle-income countries continued to receive vast sums of remittance inflows, which increased by 8 per cent between 2021 and 2022 from USD 599 billion to USD 647 billion. Since the mid-1990s, international remittances have greatly surpassed official development assistance levels defined as government aid designed to promote the economic development and welfare of developing countries; they have also recently overtaken foreign direct investment.
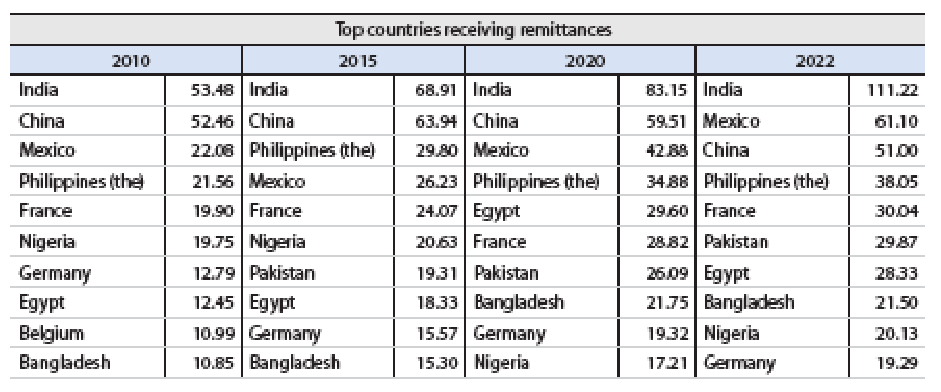
In 2022, India, Mexico, China, the Philippines and France were (in descending order) the top five remittance recipient countries, although India was well above the rest, receiving more than USD 111 billion, the first country to reach and even surpass the USD 100 billion mark. Mexico was the second-largest remittance recipient in 2022, a position it also held in 2021 after overtaking China, which historically had been the second-biggest recipient after India. G7 countries France and Germany remained in the top 10 of receiving countries globally in 2022, just as they have done for more than a decade (see Table 2). It should be noted, however, that the majority of inflows are not household transfers, but relate to salaries of cross-border workers who work in Switzerland while residing in France or Germany.
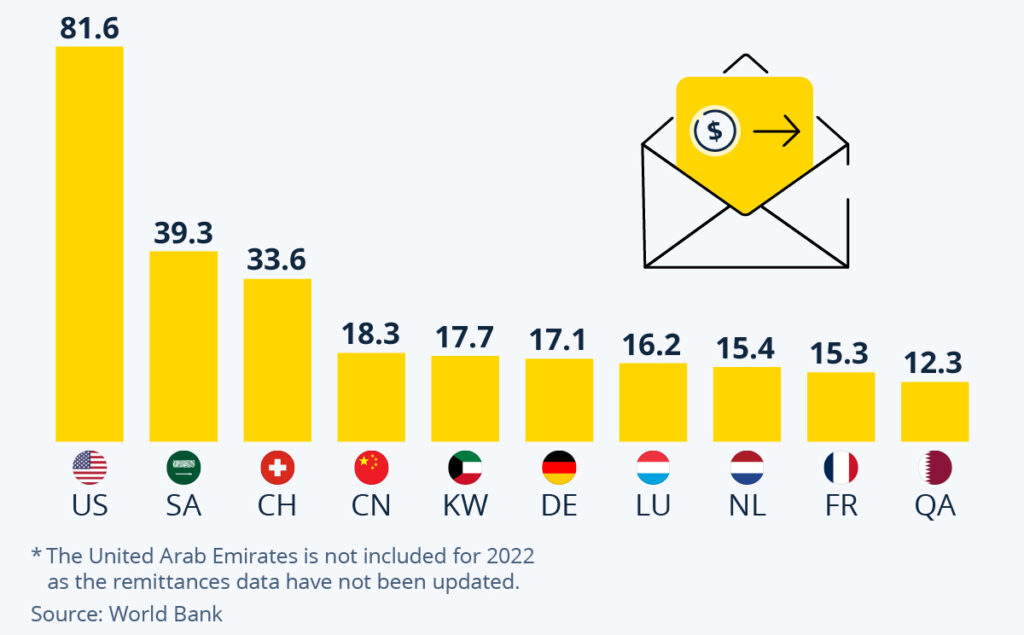
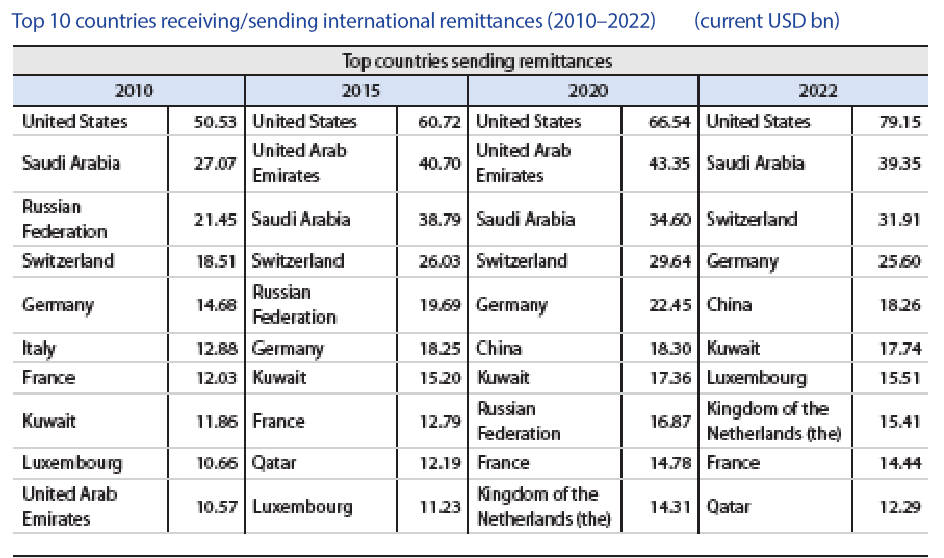
High-income countries are almost always the main source of international remittances. For decades, the United States of America has consistently been the top remittance-sending country in the world, with a total outflow of USD 79.15 billion in 2022, followed by Saudi Arabia (USD 39.35 billion), Switzerland (USD 31.91 billion) and Germany (USD 25.60 billion). The United Arab Emirates is also usually among the top 10 sending countries globally, but its data are not included/reported in the June 2022 World Bank data release. In addition to its role as a top recipient, China (classified as an upper-middle-income country by the World Bank) has also been a significant source of international remittances, with USD 18.26 billion reported in 2022, although this is a drop from USD 23 billion in 2021.
In terms of dependency on international remittances, there is no consensus on how “overreliance” on international remittances can be defined, but dependency on remittances is mostly measured as the ratio of remittances to gross domestic product (GDP). The top five remittance-receiving countries by share of GDP in 2022 were Tajikistan (51%) followed by Tonga (44%), Lebanon (36%), Samoa (34%) and Kyrgyztan (31%) (see Figure 11). Heavy reliance on remittances can cultivate a culture of dependency in the receiving country, potentially lowering labour force participation and slowing economic growth.30 Too much dependence on remittances also makes an economy more vulnerable to sudden changes in remittance receipts or exchange rate fluctuations.
Sustainable Development Goal (SDG) 10.C commits countries to reducing the transaction costs of migrant remittances to less than 3 per cent.32 The 3 per cent transaction cost is intended as the global average of sending USD 200. While the cost of sending remittances has gradually declined over the last few years across several regions (see Figure 12), it still remains high and far above the SDG 10 target. In 2022, average costs were lowest in South Asia (4.6%), followed by East Asia and Pacific, and Latin America and the Caribbean (both around 5.8%). Sub-Saharan Africa has consistently had the highest average cost of sending remittances and in 2022 the cost was at more than 8 per cent, more than double the SDG target.