
India’s merchandise exports in November 2020 were USD 23.43 billion, as compared to USD 25.77 billion in November 2019, a fall of 9.07%. Exports during April-November 2020-21 were USD 173.49 billion, as compared to USD 211.17 billion during the same period last year, exhibiting a negative growth of 17.84%.
India’s merchandise imports in November 2020 were USD 33.39 billion, as compared to USD 38.52 billion in November 2019, a decline of 13.33%. Merchandise imports during April-November 2020-21 were USD 215.67 billion, as compared to USD 324.59 billion during the same period last year, exhibiting a negative growth of 33.56%.
India is thus a net importer in November 2020, with a trade deficit of USD 9.96 billion, as compared to trade deficit of USD 12.75 billion, improvement by 21.93%.
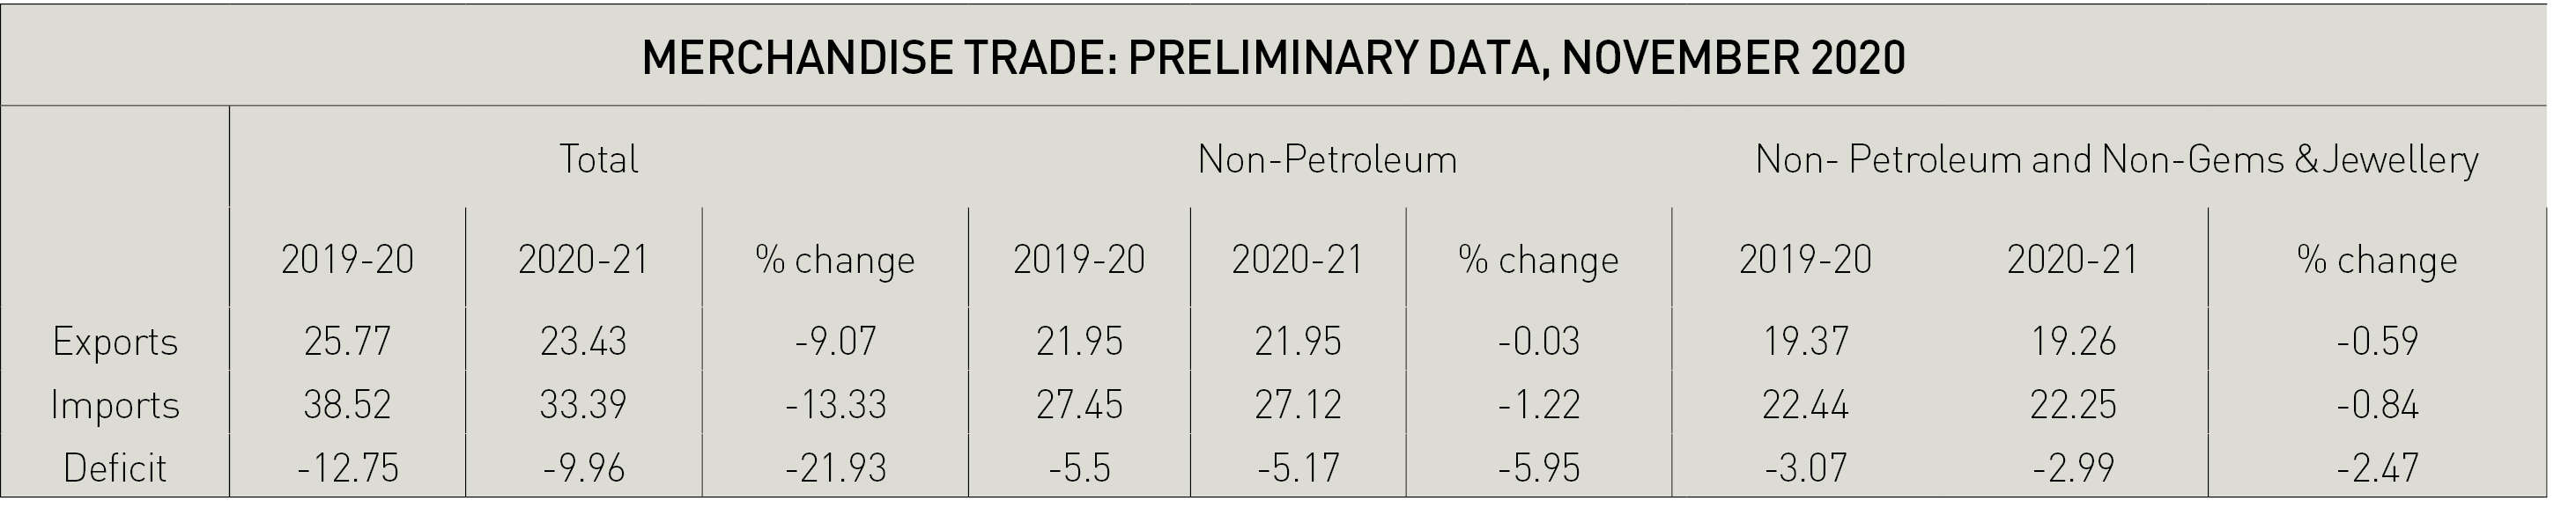
In November 2020, the value of non-petroleum exports was USD 21.95 billion, registering a negative growth of 0.03% over November 2019. The value of non-petroleum and non-gems and jewellery exports in November 2020 was USD 19.26 billion as compared to USD 19.37 billion in November 2019, registering a negative growth of 0.59%. The cumulative value of non-petroleum and non-gems and jewellery exports in April-November 2020-21 was USD 144.04 billion, as compared to USD 157.09 billion for the corresponding period in 2019-20, exhibiting a decrease of 8.30%.
In November 2020, Oil imports were USD 6.27 billion, as compared to USD 11.07 billion in November 2019, a decline by 43.36%. Oil imports in April-November 2020-21 were USD 44.10 billion, as compared to USD 85.99 billion, showing a decline of 48.71%.
Non-oil imports in November 2020 were estimated at USD 27.12 billion, as compared to USD 27.45 billion in November 2019, showing a decline of 1.22%. Non-oil imports in April-November 2020-21 were USD 171.57 billion, as compared to USD 238.60 billion, registering a decline of 28.09% during the same period of the last year.
Non-oil, non-GJ (gold, silver &Precious metals) imports were USD 22.25 billion in November 2020, recording a negative growth of 0.84%, as compared to non-oil and non-GJ imports of USD 22.44 billion in November 2019. Non-oil and non-GJ imports were USD 149.17 billion in April-November 2020-21, recording a negative growth of 25.74%, as compared to non-oil and non-GJ imports of USD 200.89 billion in April-November 2019-20.
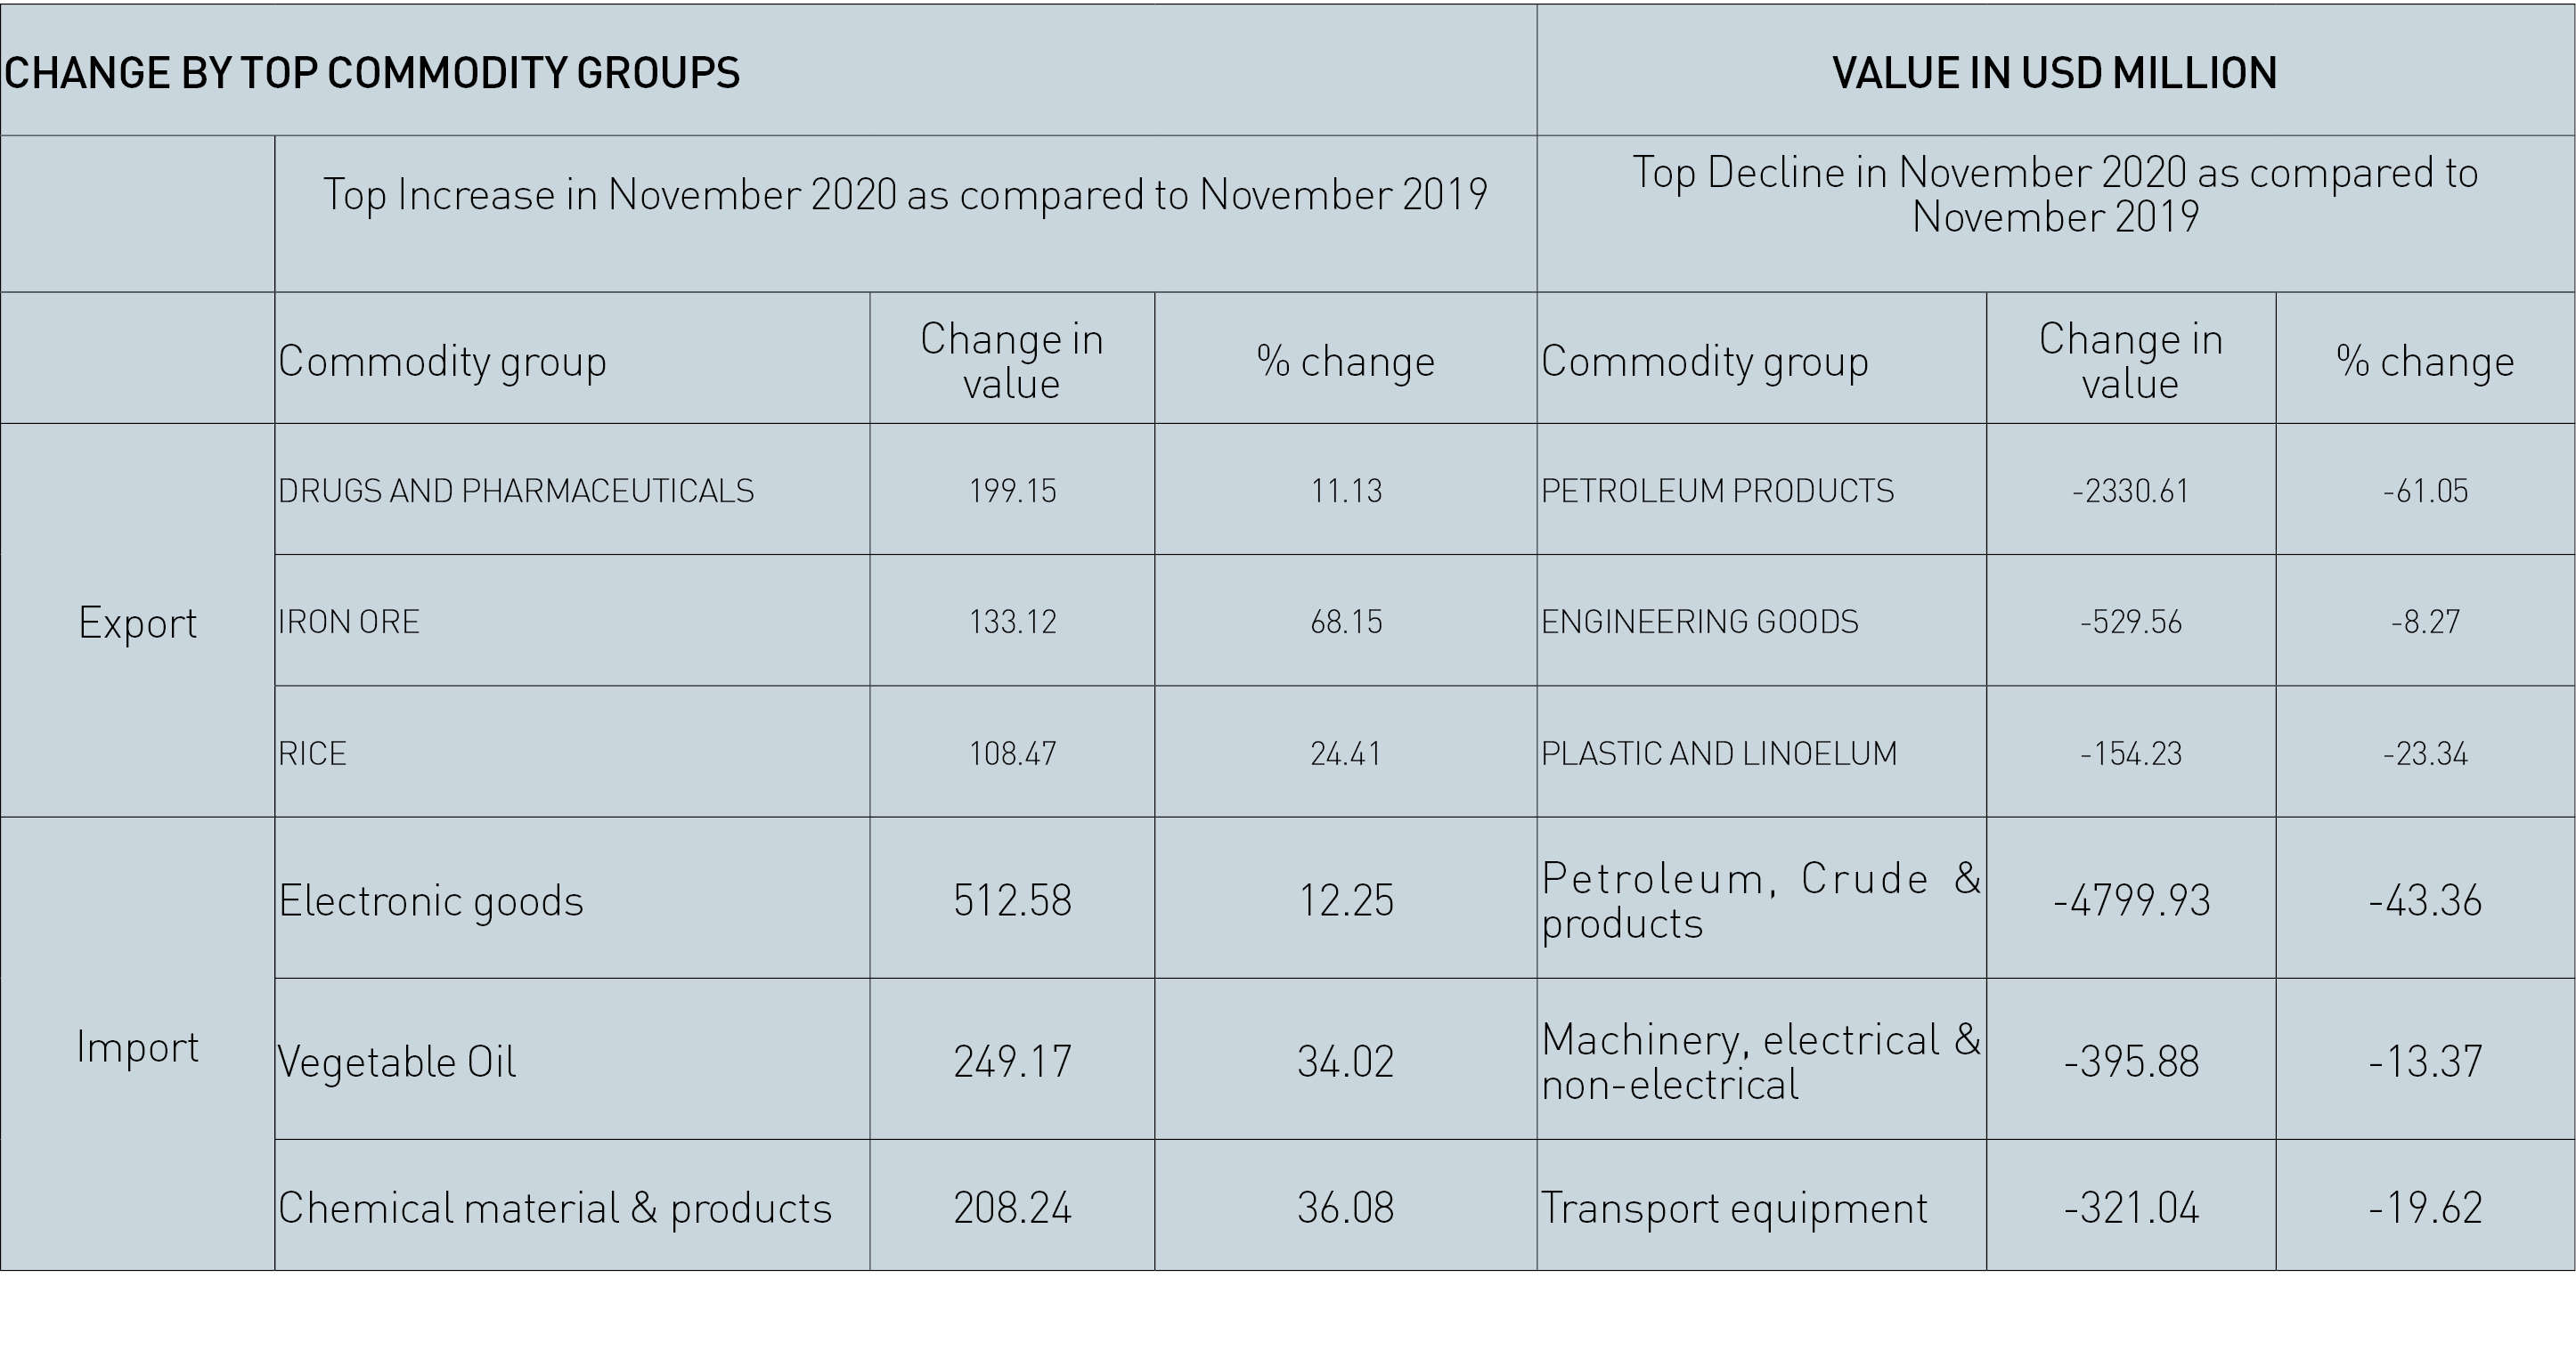
Major commodities of export which have recorded positive growth during November 2020 vis-à-vis November 2019 are: Other cereals (164.67%), Oil meals (70.54%), Iron ore (68.15%), Rice (24.41%), Ceramic products and glassware (20.98%), Handicrafts excl. Hand-made carpet (17.71%), Cereal preparations and miscellaneous processed item (16.75%), Carpet (15.58%), Jute mfg. Including floor covering (14.06%),Spices (12.12%), Drugs and pharmaceuticals (11.13%), Tobacco (8.64%), Cotton yarn/fabrics/made-ups, handloom products etc. (8.38%), Fruits and vegetables (5.33%), Tea (5.02%), Gems and Jewellery (4.11%), Mica, coal and other ores, minerals including process (2.23%),Meat, dairy and poultry products (1.34%), Electronic Goods (0.95%).
Major commodities of export which have recorded negative growth during November 2020 vis-à-vis November 2019 are Petroleum products (61.05%), Leather and leather manufactures (29.80%), Cashew (24.90%), Plastic and linoleum (23.34%), Marine products (16.11%), Oil Seeds (15.30%), Man-made yarn/fabrics/made-ups etc. (11.14%), Engineering goods (8.27%), Organic and Inorganic Chemicals (8.09%), Coffee (1.27%), RMG of All Textiles (1.20%).
Major commodity groups of import showing positive growth in November 2020 over the corresponding month of last year are: Fruits & vegetables (66.81%), Chemical material & products (36.08%), Vegetable Oil (34.02%), Fertilisers, Crude & manufactured (29.25%), Pulses (18.16%), Dyeing/tanning/colouring materials (18.07%), Electronic goods (12.25%), Non-ferrous metals (9.04%), Metaliferrous ores & other minerals (4.15%), Gold (2.65%), Medcnl. & Pharmaceutical products (0.88%).
Major commodity groups of import showing negative growth in November 2020 over the corresponding month of last year are: Silver (89.71%), Cotton Raw & Waste (74.09%), Newsprint (69.96%), Project Goods (53.01%), Leather & leather products (46.81%), Petroleum, Crude & products (43.36%), Sulphur & Unroasted Iron Pyrites (34.64%),Machine tools (26.55%), Wood & Wood products (19.81%), Transport equipment (19.62%), Pulp and Waste paper (17.09%), Machinery, electrical & non-electrical (13.37%), Textile yarn Fabric, made-up articles (13.09%), Coal, Coke & Briquettes, etc. (12.15%), Iron & Steel (10.14%), Professional instrument, Optical goods, etc. (8.30%), Pearls, precious & Semi-precious stones (7.16%),Artificial resins, plastic materials, etc. (3.45%), Organic & Inorganic Chemicals (3.23%).
India’s merchandise exports in November 2020 were $23.43 billion, as compared to $25.77 billion in November 2019, a fall of 9.07%.
India’s merchandise imports in November 2020 were $33.39 billion, as compared to $38.52 billion in November 2019, a decline of 13.33%.
India is thus a net importer in November 2020, with a trade deficit of $9.96 billion, as compared to trade deficit of $12.75 billion, improvement by 21.93%.
Value of non-petroleum and non-gems and jewellery exports in November 2020 was $19.26 billion, as compared to $19.37 billion in November 2019, a negative growth of 0.59%.
Non-oil, non-GJ (gold, silver & Precious metals) imports were $22.25 billion in November 2020, as compared to non-oil and non-GJ imports of $22.44 billion in November 2019, a negative growth of 0.84%.
Top 5 commodity groups of export which have recorded positive growth during November 2020 vis-à-vis November 2019 are: Other Cereals (164.67%), Oil meals (70.54%), Iron Ore (68.15%), Rice (24.41%), Ceramic Products and Glassware (20.98%).
Top 5 commodity groups of import showing a fall in November 2020 vis-à-vis November 2019 are: Silver (-89.71%), Cotton Raw and Waste (-74.09%), Newsprint (-69.96%), Project goods (-53.01%), Leather & leather products(-46.81%).
EEPC INDIA SEEKS EASING OF GST REFUND RULES
Sharing difficulties of engineering exporters in the midst of Covid-19 pandemic, EEPC India brought out before the Board of Trade how procedural bottlenecks have resulted in denial of GST refunds in the absence of flexibility of rules.
Making a presentation before the BoT meeting presided over by Commerce and Industry Minister Piyush Goyal, EEPC India Chairman Mr Mahesh Desai said, ” we are also facing immense working capital blockage problems due to enactment / operation of
Rule 96(10) of the CGST Rules”.
Under this rule, exporters are barred from making transactions in specific manner, for availing of the GST refunds under the IGST regime.
” But the same is causing great hardship. More importantly, this provision is causing hindrance to the promotion of exports which cannot be the policy of our Government. Flexibility in the hands of exporters cannot be taken away on account of procedural issues,” said Mr Desai.
In other submissions before the BoT, the EEPC India Chairman said the Remission of Duties and Taxes and Exported Products (RoDTEP) rate should be announced at the earliest so that it is possible for exporters to factor in the benefits from January 01, 2021. RodTep of minimum 3% should be given to all engineering products made from iron & steel so that, as and when higher rates are announced they can have higher RodTep. Incidence of duties and taxes is much higher at 7% and above.
On higher cost of borrowing, Mr Desai said banks should charge the Repo Rate plus 2.2% and the same should be notified by the Reserve Bank of India for Rupee Export Credit.
He said while the recently announced Production Linked Incentive (PLI) scheme is a good initiative for Atmanirbhar Bharat, a separate PLI scheme should be announced for the MSME sector with focus on technology upgradation.
For the engineering sector, raw materials like steel are very important. Currently engineering exporters face two major challenges – (a) availability of steel; and (b) the delay in BIS giving QCO Certificates. The BIS does not have adequate personnel to attend to the requests. EEPC India is very clear that there should be no bad quality imports and quality controls are essential. ”However, the clearance should be made time bound as we are having cases of delays of more than one year. Further, there is a need to expand steel production of the primary producers. Similarly there is a need to look at controlling the exports of iron ore so that secondary steel producers are not affected”
Welcoming the draft Merchant Shipping Bill, 2020 EEPC India Chairman said till a proper framework under the law is established, an institutionalized forum should be constituted by the Department of Commerce having representatives from CBIC, Ministry of Shipping, Ministry of Civil Aviation, EPCs and the Apex Shipping Companies Associations/freight forwarders/ICDs. Such a forum should take up issues impacting movements in cargo handling, freight rates and other procedural bottlenecks on a regular and formal basis.