
India’s merchandise exports in January 2024 registered 3.12 per cent year-on-year growth at USD 36.92 billion over USD 35.80 billion in Jan 2023, driven mainly by petroleum products, engineering goods, iron ore, electronic goods, drugs and pharmaceuticals. Merchandise imports in January 2024 were USD 54.41 billion, as compared to USD 52.83 billion in January 2023.
The country’s overall exports (merchandise and services combined) in January 2024 is estimated to be USD 69.72 billion, exhibiting a positive growth of 9.28 per cent over January 2023. Overall imports in January 2024 is estimated to be USD 70.46 billion, exhibiting a positive growth of 4.15 per cent over January 2023.
In the 10 months of the fiscal (April-January 2023-24), merchandise exports were USD 353.92 billion as against USD 372.10 billion during April-January 2022-23 while merchandise imports stood at USD 561.12 billion as against USD 601.47 billion during April-January 2022-23. Merchandise trade deficit also improved by 9.66 per cent y-o-y to USD 207.20 billion in April-January 2023-24 from USD 229.37 billion in the same period of 2022-23.
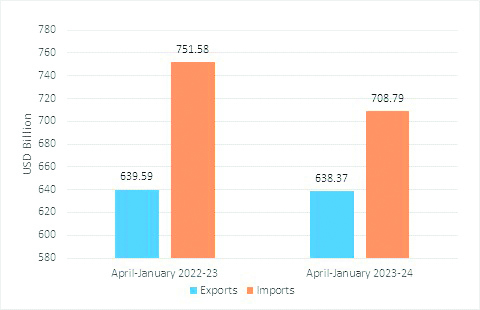
India’s overall exports, combining both, are estimated to be USD 638.37 billion, exhibiting a negative growth of 0.19 per cent over April-January 2022-23 and overall imports are estimated to be USD 708.79 billion, exhibiting a negative growth of 5.69 per cent over April-January 2022-23. The overall trade deficit improved by 37.11 per cent y-o-y to USD 70.43 billion in April-January 2023-24 from USD 111.99 billion.
Sectorally, non-petroleum and non-gems and jewellery exports, which comprises the basket of gold, silver and precious metals, saw a marginal improvement in January 2024 at USD 26.12 billion, compared to USD 25.48 billion in January 2023. Imports of gold, silver and precious metals in January 2024 were USD 33.72 billion, compared to USD 34.51 billion in January 2023. During April-January 2023-24, non-petroleum and non-gems and jewellery exports were USD 256.83 billion, as compared to USD 259.21 billion in April-January 2022-23 and imports of the same basket of goods were USD 354.46 billion in April-January 2023-24 as compared to USD 367.51 billion. The estimated value of services export for January 2024 is USD 32.80 billion, as compared to USD 28.00 billion in January 2023 while the estimated value of services import for January 2024 is USD 16.05 billion as compared to USD 14.83 billion in January 2023.
The estimated value of services export for April-January 2023-24 is USD 284.45 billion as compared to USD 267.50 billion in April-January 2022-23. The estimated value of services imports for April-January 2023-24 is USD 147.68 billion as compared to USD 150.11 billion in April-January 2022-23. The services trade surplus for April-January 2023-24 is estimated at USD 136.77 billion as against USD 117.38 billion in April-January 2022-23.