
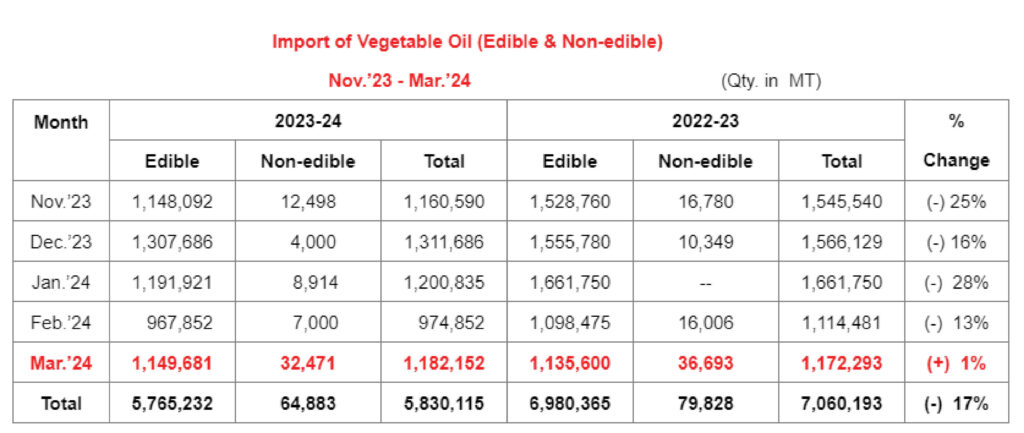
The Solvent Extractors’ Association of India has compiled the Import data of Vegetable Oils (edible & non-edible) for the month of March 2024. Import of vegetable oils during March 2024 is reported at 1,182,152 tons compared to 1,172,293 tons in March 2023, consisting 1,149,681 tons of edible oils and 32,471 tons of non-edible oils i.e. up by 1%. The overall import of vegetable oils during first five months of the oil year during Nov.’23 to Mar.’24 is reported at 5,830,115 tons compared to 7,060,193 tons during the same period of last year i.e. down by 17%.
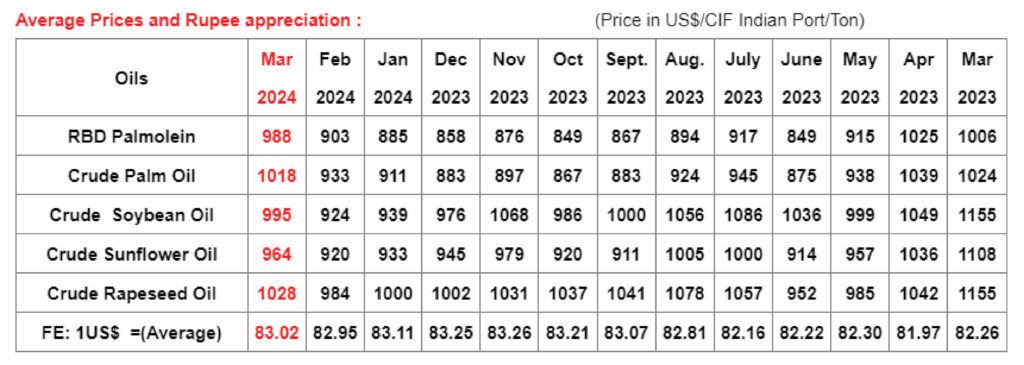
Palm Oil expensive than Sunflower Oil US$ 70/tons
Palm Oil is currently price leader. In last few weeks, thanks to lower production and Stock of Palm Oil in Indonesia & Malaysia, resulted in short supply. Future at BMD, at 3rd Month crossed 4,400 ringit per tons. On 5th April, C & F India CPO was quoted at US $ 1045/tons while Crude Sunflower Oil was cheaper and available at US $975/tons and Crude Soybean Oil at US $ 1025/tons. This lead to shift in demand from Palm Oil to Soft Oils which is also evident, from the fact that India imported a record quantity of Sunflower Oil in last two months, February 297,000 tons and in March received highest monthly quantity of 446,000 tons.
The ratio between Palm Oil and Soft oils during March 2024 tilted in favour of soft oils representing nearly 58% vis a vis 42% Palm oil. In March Refined Palm Oil also reduced to 94,000 tons from previous month 125,000 tons. The overall import of refined Palm Oil during November 23 to March 24 in slightly lower at 887,000 tons compared to 989,000 tons same period of last year.
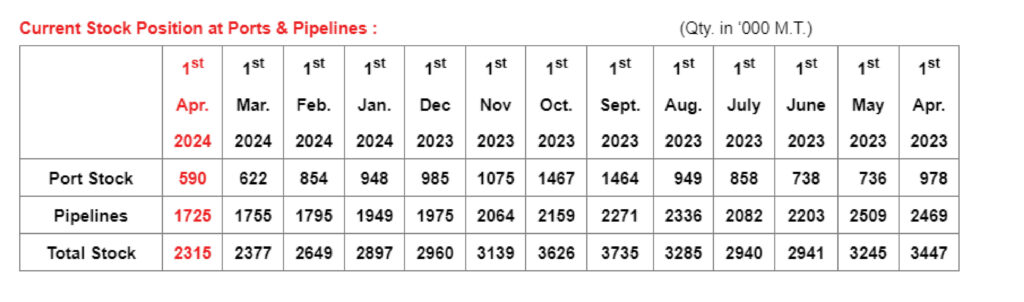
Domestic Stock as on 1st Apr. 2024
The stock of edible oils as on 1st Apr.,2024 at various ports is provisionally estimated at 590,000 tons (CPO 165,000 tons, RBD Palmolein 68,000 tons, Degummed Soybean Oil 105,000 tons and Crude Sunflower Oil 252,000 tons) and pipeline stock considering domestic production and consumption reported at 1,725,000 tons. The Total stock as on 1st Apr., 2024 reported at 2,315,000 tons compared to 2,377,000 tons as on 1st Mar., 2024 reduced by 62,000 tons and compared to Apr.’23 down by 11.32 lakh tons.
Import of Palm Oil and Soft Oil
During Nov.’23-Mar.’24 first five months of oil year 2023-24, Palm Oil import decreased to 3,529,839 tons from 4,399,128 tons, Also Soft Oil import has decreased to 2,235,394 tons from 2,581,234 tons in Nov.’22-Mar.’23,. Share of Palm Oil decreased to 61% from 63% However, Soft Oils share increased to 39% from 37% compared to last year of Nov.’22-Mar.’23.
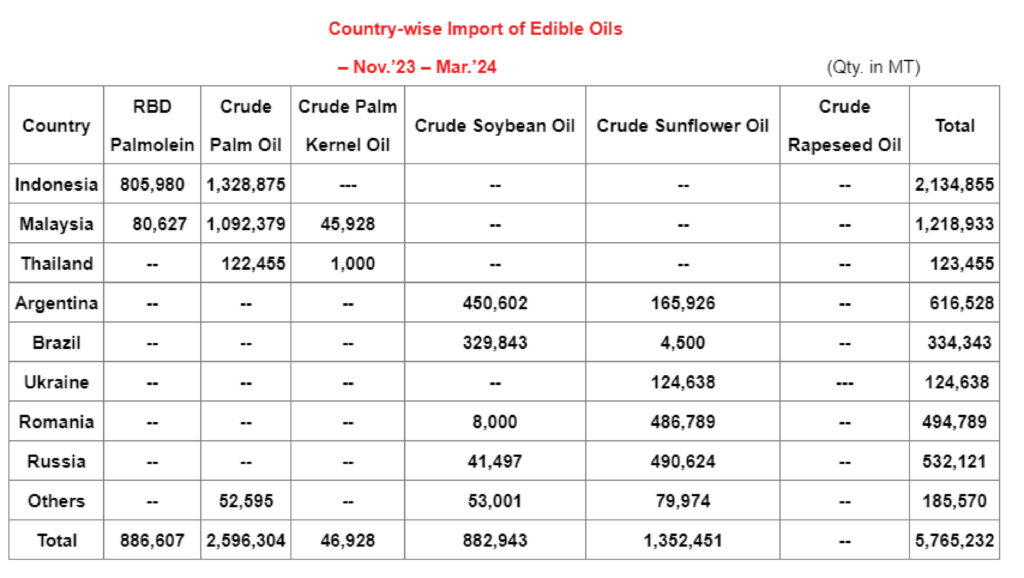
Country-wise Import of Palm & Soft Oil:
Indonesia and Malaysia are the major suppliers of RBD Palmolein and Crude Palm Oil to India. During Nov.’23-Mar.’24, Indonesia was major supplier of CPO (1,328,875 tons) and RBD Palmolein (805,980 tons) followed by Malaysia of CPO (1,092,379 tons),RBD Palmolein (80,627 tons) and CPKO (45,928 tons). In case of Crude Soybean Degummed Oil, India mainly imported from Argentina (450,602 tons) followed by Brazil (329,843 tons) while Crude Sunflower Oil mainly imported from Romania (486,789 tons) followed by Russia (490,624 tons), Argentina (165,926 tons) and Ukraine (124,638 tons).
Import of Non-edible Oils
P.F.A.D. and P.K.F.A.D are the major non-edible oils being imported by the Soap and Ole-chemical industry. Import of Non-edible
oils during Nov.’23 to Mar.’24 reported at 64,883 tons compared to 79,828 tons during the same period of last year i.e. down by 19%.