
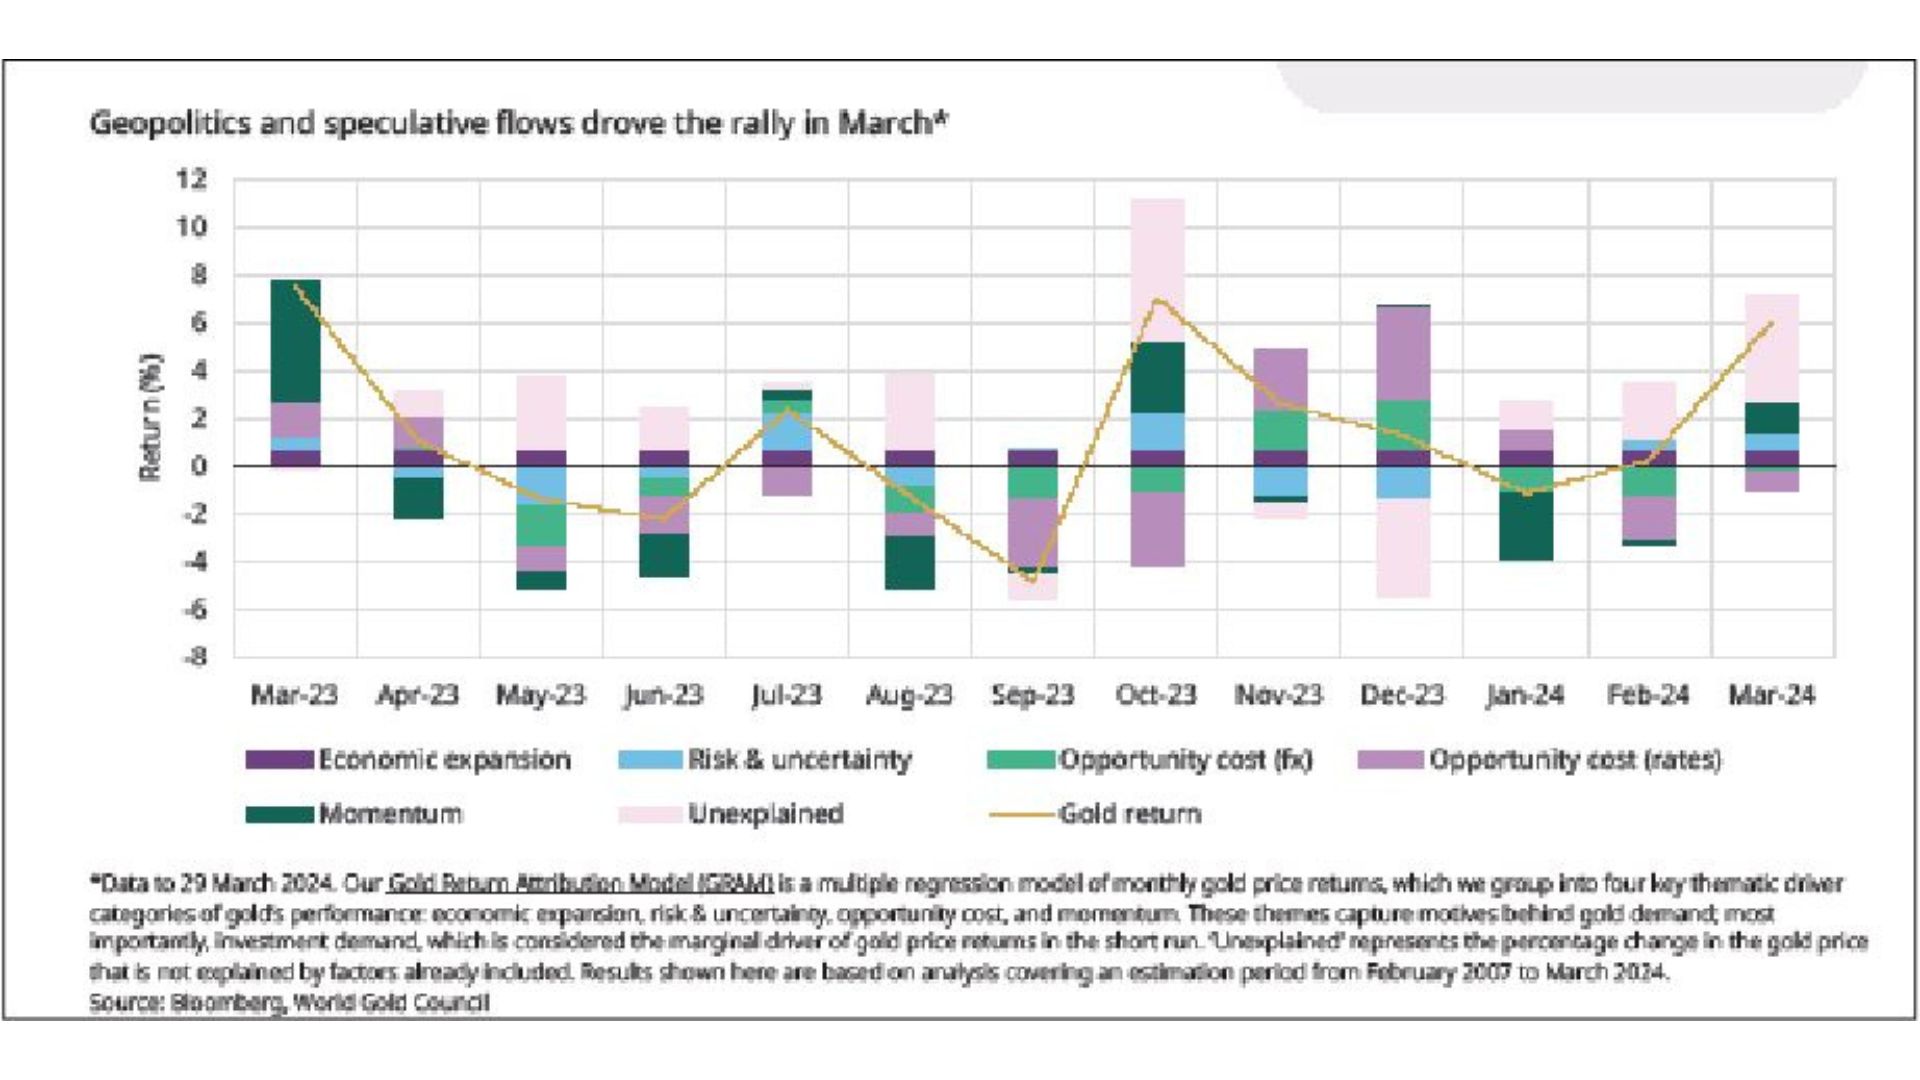
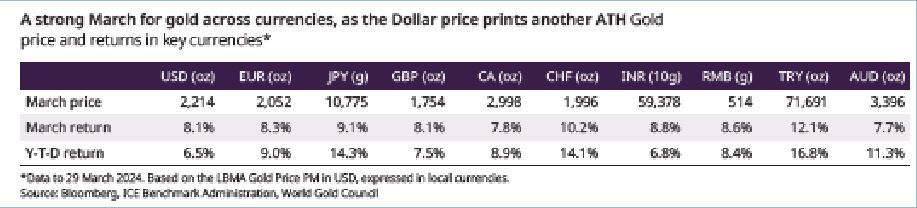
Gold prices scaled new heights in March, finishing 8.1% higher at US$2,214/oz by the end of the month.A flat US dollar ensured that the strong return was reflected in all the major currencies, according to World Gold Council’s monthly report.
The rally that started in early March left some commentators scratching their heads as to the cause. Our Gold Return Attribution Model (GRAM) suggested Risk and Momentum factors were behind the move higher. Particularly instrumental was gold’s implied volatility, which shot up during March — as it did during September 2022, March 2023 and October 2023, although this time it was not accompanied by a rise in bonds’ implied volatility (MOVE index) and therefore more suggestive of a gold-specific punt. In our Momentum bucket, COMEX managed money futures net positions had their third strongest month since 2019 on both short covering and fresh longs and we saw flows into gold ETFs in all regions bar Europe. The Geopolitical Risk (GPR) index moved higher again, as geopolitical tensions convulsed across several fronts. From a macro perspective – despite heady markets and a soft Fed – there was an important crossover in US data surprises suggesting stagflation risks might be on the rise again, a supportive development for gold prices.
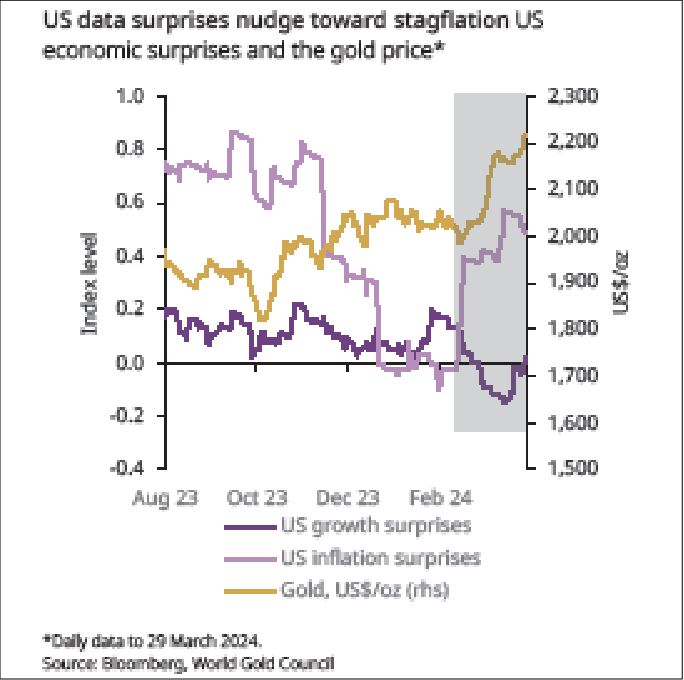
US economic surprises and the gold price
Looking forward
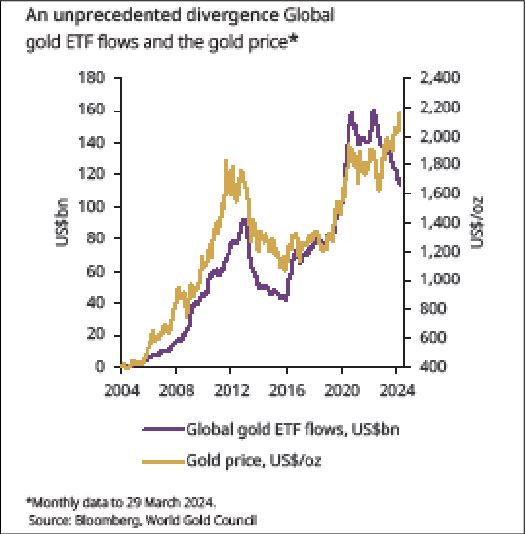
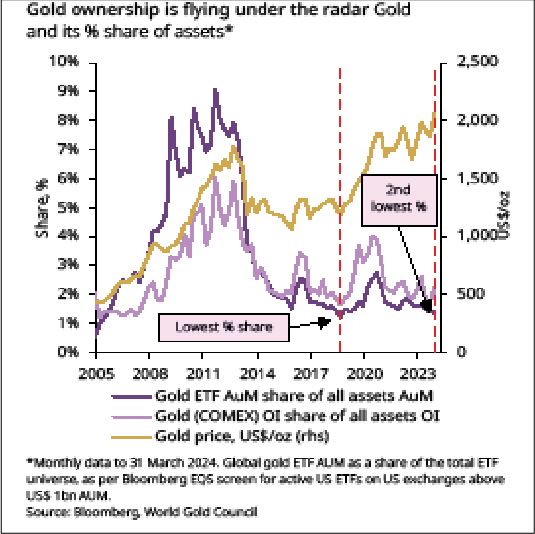
• An unprecedented disconnect has appeared between gold prices and global gold ETF flows, driving a wedge between comparisons of the current all-time-high (ATH) to that of the 2011 spike
• We find that US gold ETFs as a share of total US ETFs2 is considerably lower than it was 13 years ago and below what many would consider an optimal weighting.
• The fundamentals underpinning the current rally include growing geopolitical risk, steady central bank buying and resilient demand for jewellery and bars and coins.
• Together with the prospect of lower interest rates ahead the suggestion is that ETFs have missed the rally and are now under-allocated.
• India, the world’s largest democracy, goes to the polls in April. The market will see little activity during the six election week period. To boot, a diminished wedding season on the other side suggests that, all else equal, we should not expect to see any pent-up demand from Indian consumers in June.
ATH in price ≠ ATH in ownership
With gold reaching all-time highs the default assumption for most would be that positioning is likely crowded, as it appeared to be in 2011 for example, but that is not the case.
When assessing gold ETFs as a percentage of total US ETF AUM we found their percentage share is at the fourth lowest level since inception. While past performance does not guarantee future returns, it is worth noting that the last time positioning reached these levels gold embarked on a substantial move higher with considerable support from global gold ETFs.
Similarly, we have found that open interest in the futures market resembles trends that we see across the ETF space; gold’s open interest is well below that of a set of futures across equities, bonds and commodities.
Despite its high price, we currently view gold to be under-owned, and unlike previous rallies this time it does not look as “toppy”.
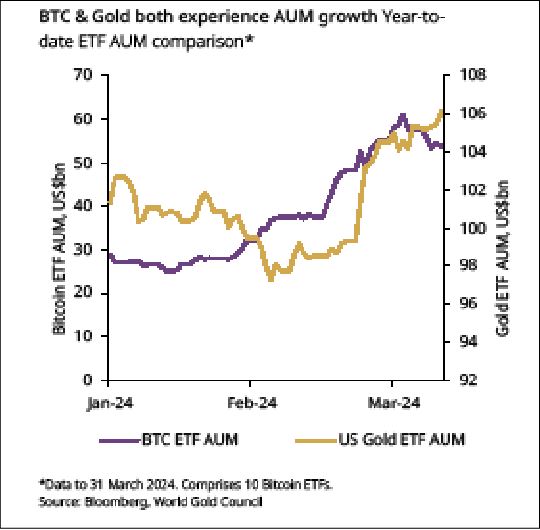
Fact versus fiction Last month’s news cycle was laser-focused on the amount of capital flowing into bitcoin (BTC) ETFs, and some of that narrative centred on capital leaving gold ETFs for BTC-backed funds. We see no data to support this narrative, and are not alone in our thinking.
• Outflows from global gold ETFs – and particularly EU-listed funds – began long before BTC-ETFs launched anddid not accelerate once they had.
• To boot, these were less pronounced in US dollar flowsterms. After all, investors sensibly allocate on the basis ofcapital invested and not on the basis of ounces acquired.
• And over recent weeks, AUM growth in BTC and US goldETF products has been strongly correlated.
We view outflows from gold ETFs as speculative rather than structural and inflows into Bitcoin ETFs as speculative rather than structural, supported by findings from our survey work.
We don’t know if we are witnessing a turning point. However, the evidence suggests there are more potential buyers than sellers.
We also view recent North American inflows and a softening in European outflows as hinting at a turning point.
The world’s largest democracy is set to vote
On 19 April India begins its seven-phase general election that will last 44 days and conclude on 1 June.5 Gold consumption tends to be impacted during the election season as there is heightened scrutiny on the movement of cash, gold, and jewellery.
Anecdotal evidence suggests that the various industry stakeholders (bullion dealers, manufacturers, and jewellers) limit their transactions during this time.
Data shows that gold consumption has fallen during three of the last four general election periods with a decline in demand for both jewellery (comprising over 70% of Indian consumer demand) and bar and coin. We did see a rise in gold consumption during the 2019 election season, but this was linked to the higher number of auspicious days and a softening of gold prices.
The bottom line here is that political events likely will have gold price repercussions this year. Despite the country’s size and importance, India’s election is likely to be somewhat of a damp squib for gold demand.
In summary
Gold is at an all-time-high and is getting attention. But assets at such levels are challenging for investors who think they may have missed the boat. However, our analysis suggests that gold is currently well supported by fundamentals, and the low participation from US investors in particular augurs well for the rally to continue, in contrast to what we saw in 2011.
Alongside gold’s records, we’ve also seen all-time highs in the prices of many other assets including global equities.6 Gold’s share of assets is low not only from the unrelenting push higher in the prices of other assets but the large issuance of financial securities. Gold’s physical supply constraints means that its price has to do the heavy lifting to maintain a sensible share of assets. We’ve not yet seen this materialise, which is encouraging.