
According to a report by the Niti Aayog Working Group, food demand comrises the direct demand as food and the other uses such as seed, feed, and raw material for processing and other industries.The availability of food comprises domestic production, carry-over stock and imports, says the report titled ‘Crops Husbandary, Agriculture Inputs, Demand and Supply.’
At any point in time, the demand and supply should be equal, and any deviation from the equilibrium is corrected by price changes. In case of demand being more (less) than supply of a commodity, its price is expected to rise (fall) in the absence of any market intervention.
The following procedure has been adopted to project food demand and supply.
i. Construct a food balance sheet and estimate components of demand and supply for the base year, i.e. 2011-12.
ii. Estimate direct demand for human consumption and indirect demand as seed, feed, wastages and other uses for 2019-20.
iii. Compare the projected demand for 2019-20 with the actual availability, and validate accuracy of the estimates.
iv. Project crop area and yield of crops, and derive production estimates for future, i.e., for 2025-26, 2030-31, 2035-36, 2040-41, and 2047-48. Plug these estimates into the demand core system for estimating the demand for seed and feed.
v. Develop future scenarios and project the total demand and production under these scenarios.
vi. Externally validate projected demand by comparing it with normative demand.
vii. Estimate demand-supply balance to estimate potential surplus or short fall.
Direct demand for human consumption is the largest component of the total food demand. The HCE surveys provide estimates of the food consumed by the resident households. The latest HCE data is available for 2011-12; hence it has been taken as the base for projections. The unavailability of the latest estimates, helped in testing the model for its accuracy by comparing the projected food demand for 2019-20 with the actual availability. Further, the projected food demand is compared with the normative requirement for external validation of the projections.
Food balance sheet for 2011-12
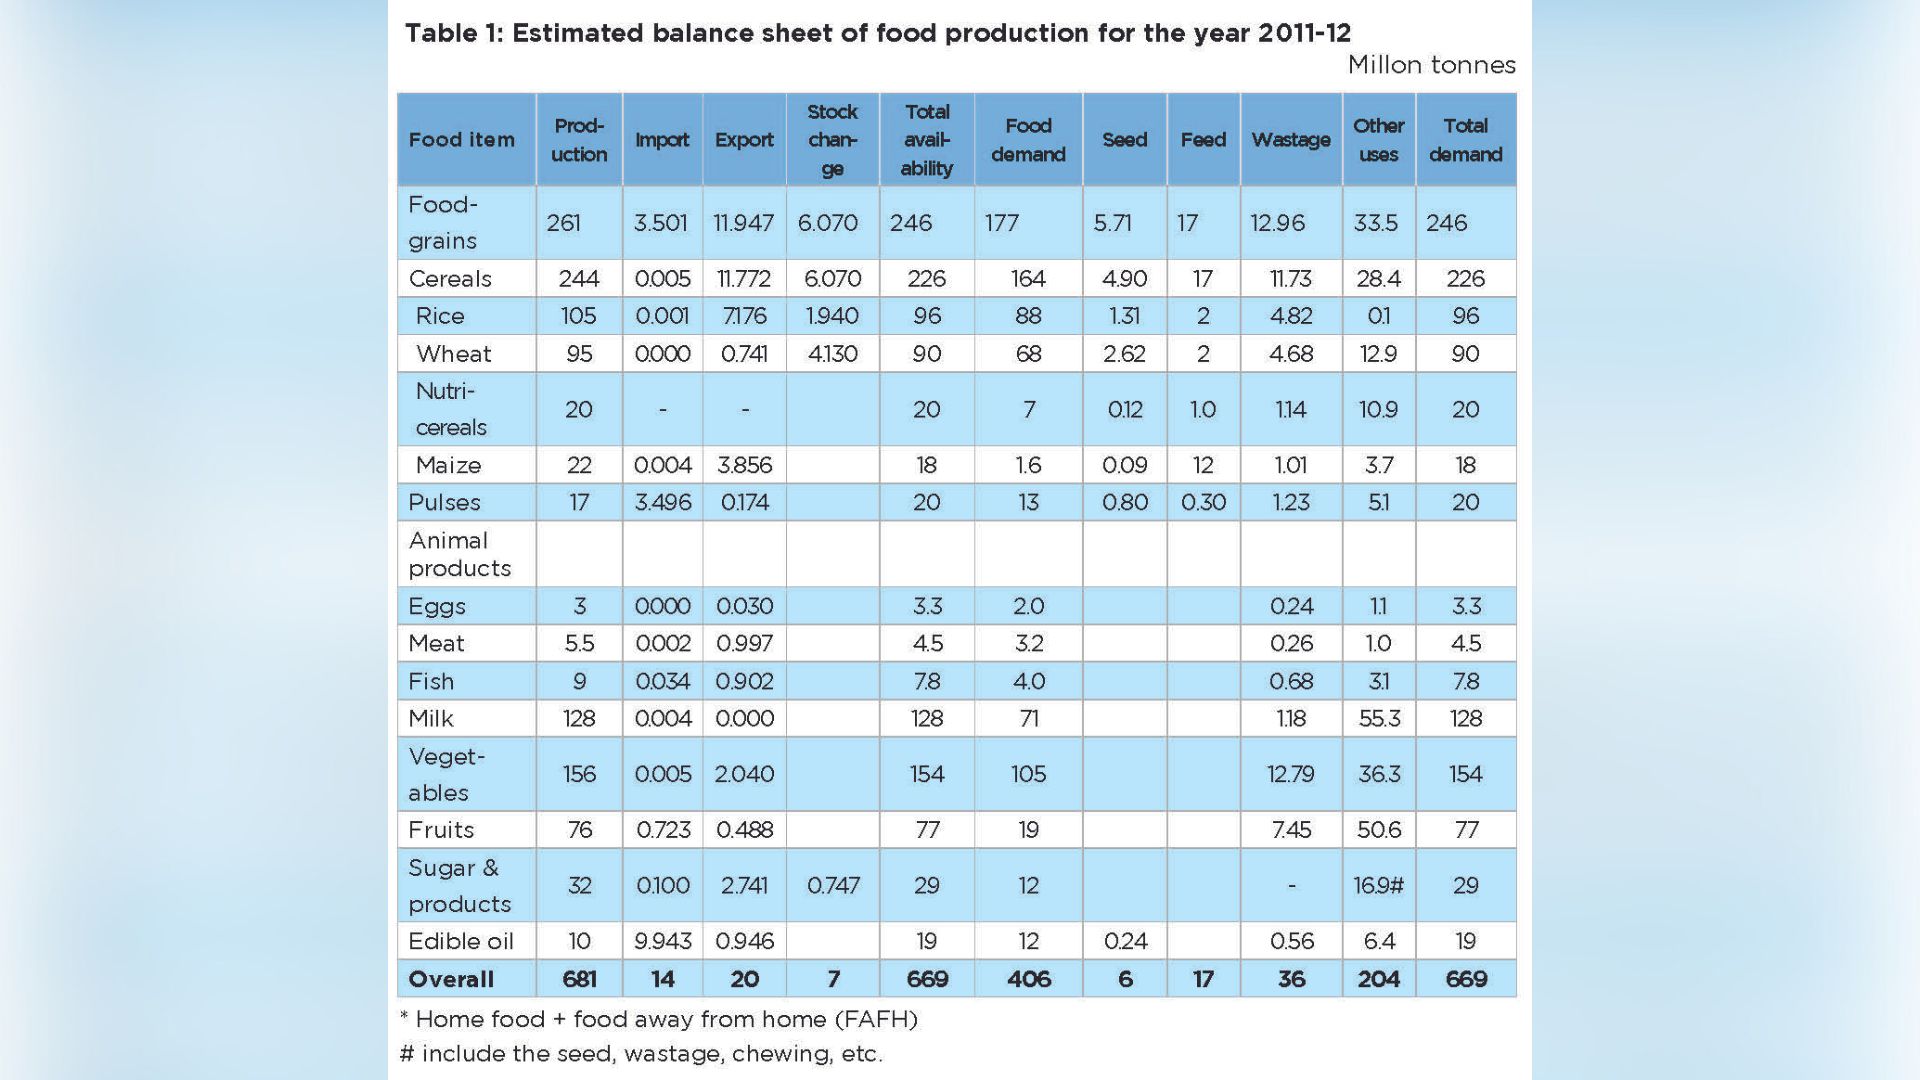
The food balance sheet provides a snapshot of the sources of food and its utilization
(Table 1). The availability of a commodity depends on its production, net export and change in stocks. In 2011-12, India produced 261 million tonnes of foodgrains, of which 12 million tonnes were exported and 6 million tonnes were stocked (public). India also imported 3.5 million tonnes of pulses. Thus, the net availability of foodgrains was 246 million tonnes. The production and net availability of different food commodities are given in Table 1. Including other foods, a total of 669 million tonnes of food was available in 2011-12.
The estimates of utilization of food commodities are not readily available, except per capita household home food consumption.
The utilization pattern of different food commodities for food, seed, feed, wastages, and other uses has been derived using the available information. Other food uses include raw material for food processing and other industries. These are estimated as residuals, that is, the difference between actual availability and consumption as food, seed, feed and wastages. Accordingly, 61 % of the total available food in 2011-12 was consumed directly as food (Table 1).
Estimating components of food demand
The household food demand comprises the demand for home food and food away from home (FAFH), the demand for feed, seed, wastages and other uses.
Seed demand: Farmers use either purchased seeds or seed saved from previous harvests. The seed demand from a home-produced crop depends on its cropped area, seed rate and seed replacement rate. Area under crops has been compiled from the Directorate of Economics and Statistics (DES) of the Ministry of Agriculture and Farmers Welfare (MoAFW). The average seed rate of a crop at national level is weighted average of its seed rate in major producing states with cropped area as weight. The state-wise seed rate has been taken from the cost of cultivation (CoC) scheme for 2011-12. The seed replacement rate (SRR) is the rate at which farmers replace home-grown seeds with certified seeds. The SRR differs across crops, and it has increased over time, meaning a decline in the demand for home-grown seeds. The estimated seed demand for different commodities is presented in and Table 1.
Feed demand: Feed consists of green and dry fodders, and concentrates, in varying proportion from 40 to 80% for crop residues, 10 to 30% for green fodder and 10 to 30% for concentrates (Roy et al. 2019). Green and dry fodders, obtained from arable lands, common property lands (permanent pastures, grazing land, etc.), crop residues and by-products, are the main source of energy for animals. Concentrate feed consist of oilseed cakes, crushed pulses, grains, wheat and rice brans, mineral mixtures, etc. The ICAR-National Institute of Animal Nutrition and Physiology (NIANP) estimated demand for concentrates at 56.2 million tonnes for 2011-12, of which grains constituted 30%. Accordingly, 16.9 million tonnes of grains were used as feed. Further, feedgrain comprised 53% of maize, 5% of nutri-cereals, and 2% of rice, wheat and pulses.
The contributions of crops to feedgrains in 2011-12 are presented in Table 5.1.
Wastages: Post-harvest loss considered as a component of the total demand. The loss differs across food commodities, depending on their perishability and post-harvest processes of conversion of raw material into final product. The ICAR-Central Institute of Post-Harvest Engineering and Technology (CIPHET) and the NABARD Consultancy Services (NABCONS) have estimated post-harvest loss for various agricultural commodities (Jha et al, 2015; NABCONS, 2022), which are given in Appendix 5.2. Utilizing the loss coefficient, the total output loss in crop has been estimated for 2011-12 (Table 5.1).
Home food and food away from home (FAFH) demand: Food cooked within household premises constitutes the largest component of food demand. The household demand for home food has been estimated using the per capita consumption reported in type-II (mixed recall reference period) schedule of the HCE survey, 2011-12 (Appendix 5.3). The HCE survey also provides expenditure on meals consumed outside the home. In 2011-12, of the total food expenditure, 8.5% was towards the processed foods and the foods consumed outside home. The cost of food cooked at home is approximately 30% of the cost incurred outside. Therefore, to estimate food consumed outside home, the expenditure share of the outside food has been adjusted by a factor of 0.3. Accordingly, the food away from home accounted for 2.59% of the total food consumed. This proportion is close to the estimate of 3.7% on foods taken in restaurants as provided by the Consumer Pyramid Surveys conducted by the Centre for Monitoring Indian Economy