
The global economy faced challenges even before the COVID-19 pandemic and the Russian Federation’s invasion of Ukraine, experiencing a decade of slowing growth. The pandemic-induced global recession in 2020 exacerbated this slowdown, and the invasion of Ukraine in February 2022 added further complications.
These adverse events not only led to a decline in actual global output growth but also had a dampening effect on potential growth – the rate of increase in potential output, which represents the level of output an economy could sustain at full capacity utilization and full employment.
This decline in potential growth has significant implications for various macroeconomic and development outcomes, impacting improvements in living standards and efforts towards poverty reduction.
Comparison of different measures of potential growth
The estimated rates of potential growth resulting from the application of these methods differed in their levels and evolutions over time. This section briefly explores these differences.
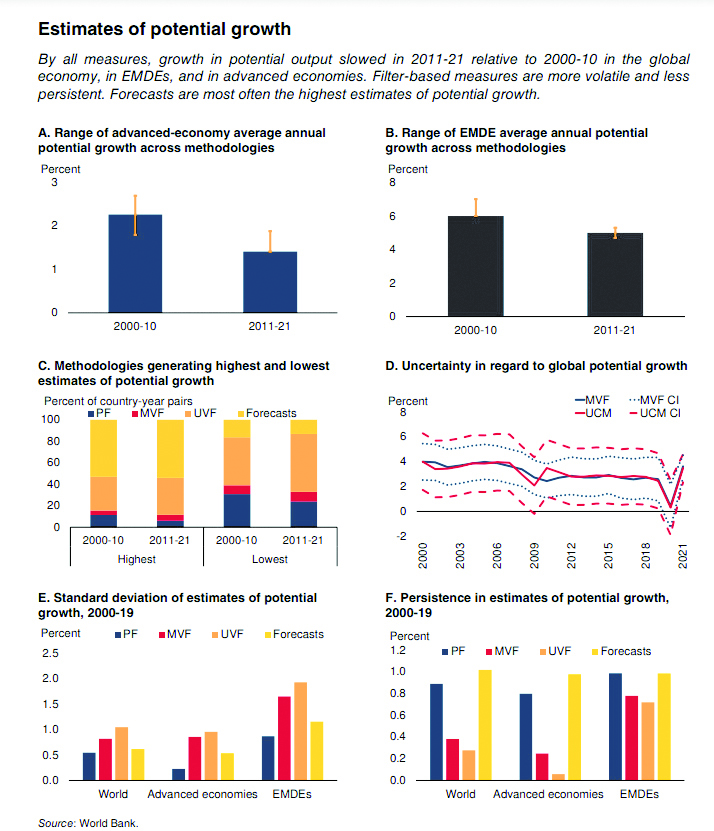
Firstly, variations in estimates of potential growth were more pronounced for advanced economies than for Emerging Market and Developing Economies (EMDEs). Throughout 2000-21, potential growth estimates derived from forecasts ranked as the highest among the nine measures in over half of the country-year pairs. Conversely, univariate filters consistently generated the lowest estimates. This pattern held at the country level as well, with forecast-based measures of potential growth generally being the highest, while measures from univariate filters tended to be the lowest, particularly in the last decade.
Secondly, estimates of potential growth based on multivariate filters exhibited narrower confidence bands compared to those based on univariate filters. This distinction is likely attributed to the inclusion of additional demand pressure indicators in multivariate filters, enhancing the accuracy of output gap identification.
Thirdly, estimates of potential growth at the global, advanced-economy, and Emerging Market and Developing Economy (EMDE) levels, derived from both univariate and multivariate filters, typically exhibit the highest variances. In contrast, estimates based on the production function approach consistently have the lowest variances.
Fourthly, univariate filter-based estimates exhibit the least persistence, particularly in the case of advanced economies, whereas estimates derived from forecasts and the production function approach display the highest persistence across all country groups.
These findings align with intuition, as filter-based estimates are specifically designed to capture time-series variation, while the others rely on more enduring drivers of potential growth.
Fifthly, estimates derived from various multivariate and univariate filters demonstrate high correlations, with a median within-country correlation coefficient exceeding 85 per cent. However, these estimates only exhibit moderate correlations with estimates from the production function approach and analysts’ forecasts.
Likewise, production function-based and forecast-based estimates display only moderate correlations with each other, while estimates from the two sources of growth forecasts used in this chapter demonstrate a high correlation with each other.
In conclusion, as anticipated, estimates of potential growth based on filters derived from the unobserved-components model exhibit the closest tracking of actual growth, boasting an average correlation coefficient of 0.95 across the country sample.
Following closely are estimates based on the multivariate filter and other univariate filters. As expected, the production function approach, constructed from slow-moving variables, diverges more from actual growth, showing a correlation of 0.45.
The correlation is even lower for forecast-based measures of potential growth, as they typically change only when forecasters adjust their views about long-term growth drivers.