
India is envisioned to be in the league of developed nations by 2047, the centenary year of its Independence. To realize this vision, the economy has to grow at an accelerated rate of about 8% per year or so, from the 6.34% realized in the recent decade.
In 2047, India’s population will cross the 1.6 billion mark, and about half of it is expected to be urbanized. There will be a demographic transition, in terms of age, literacy, and workforce participation. These trends will cause a significant change in dietary patterns and an increase in demand for different food commodities although differentially, depending on the consumer preferences. Besides the food demand for human consumption, there will be an increasing demand for food commodities in feed, fuel, and pharmaceutical industries.
On the other hand, the country has limited land and water resources, which will shrink in future on account of their competing demand for domestic, energy and industrial uses.
Concurrently, the food production system will also come under a confluence of several biotic and abiotic pressures, including climate change and infestation of insect pests and diseases, which may adversely affect crop yields and food supplies in the absence of remedial measures. Therefore, managing food in the future, from both demand and supply sides, will be a major concern for policy makers and the scientific community. To assess the demand and supply of different food commodities towards 2047, the National Institution for Transforming India (NITI) Aayog, constituted a Working Group on Crop Husbandry, Agriculture Inputs, Demand and Supply. The group studied and examined the changing consumer preferences for food and related items.
Changes in Consumer Preferences for Food
Food preferences evolve in response to changes in income, prices, demographics, lifestyles, and the diversity in available foods. This chapter analyses the changes in food preferences of rural and urban consumers and of different expenditure or income classes, using data from different rounds of the quinquennial ‘Household Consumer Expenditure (HCE)’ surveys conducted by the National Sample Survey Office (NSSO) of the Ministry of Statistics and Programme Implementation, Government of India. These surveys provide detailed information on the consumption of food and non-food commodities, in quantity as well as value. The latest available HCE survey is for 2011-12. For the later years, the Group has relied on data on private final consumption expenditure (PFCE) from the National Accounts Statistics for extrapolating food demand from 2011-12 onwards.
Changes in consumption pattern: HCE surveys from 1972-73 to 2011-12
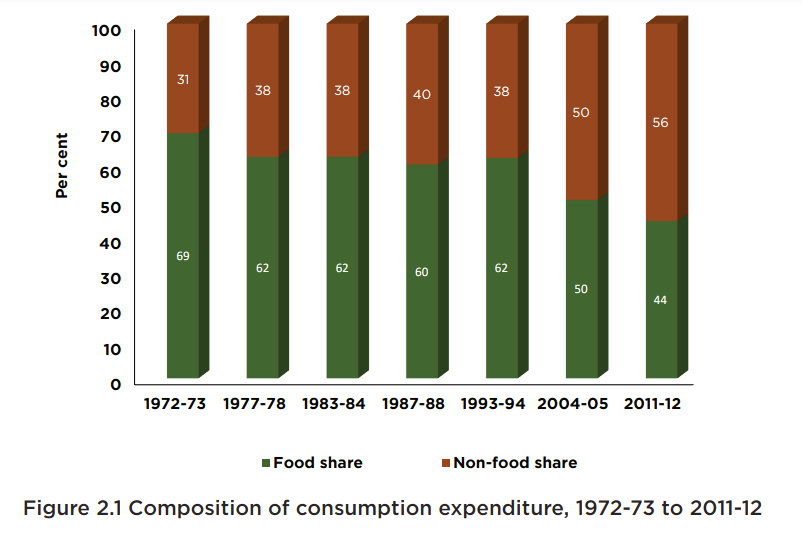
There has been a rising trend in consumption expenditure, and being accompanied by significant changes in its composition (Figure 2.1). The per capita consumption expenditure (at 2011-12 prices) increased by 62.87% between 1972-73 and 2011-12, largely driven by non-food commodities. Food accounted for a lion’s share (69%) in the total consumption expenditure in 1972-73, but after remaining around 62% between 1977-78 to 1993-94, it declined drastically to 44% in 2011-12. While the total consumption expenditure (in real terms) has grown at an accelerated rate, the food expenditure has not exhibited a similar trend. The food expenditure experienced a negative growth during 1972-73 to 1983, and 1993-94 to 2004-05.
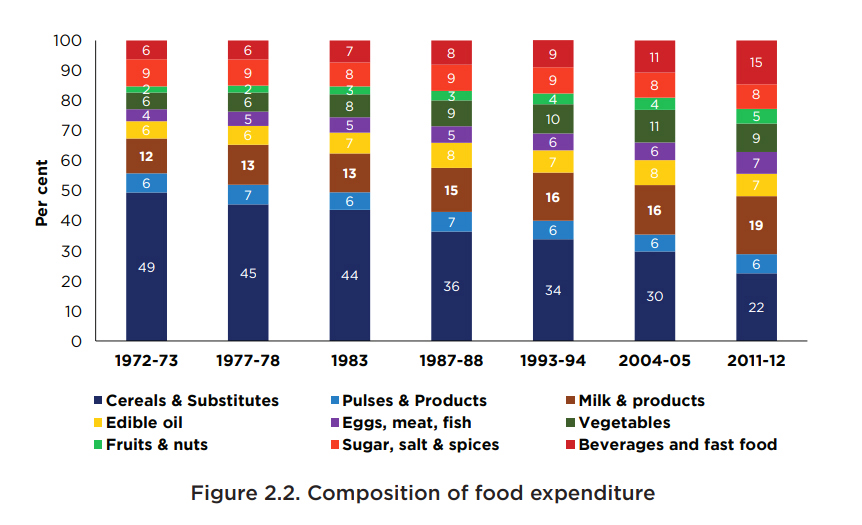
Significant changes have taken place in the food basket. Cereals which accounted for about half of the total food expenditure in 1972-73, have gradually lost their share, declining to 22% in 2011-12 (Figure 2.2). On the other hand, the shares of high-value commodities, including the fruits, vegetables, milk, meat, fish and eggs, in the food expenditure have increased substantially from 24% in 1972-73 to 40% in 2011-12. Disaggregated by commodity, the share of animal-source foods increased from 16% to 26 %, and of fruits and vegetables from 8% to 14%. Interestingly, there has been a notable surge in the share of processed foods (including beverages and fast foods) from 6% in 1972-73 to 15% in 2011-12.
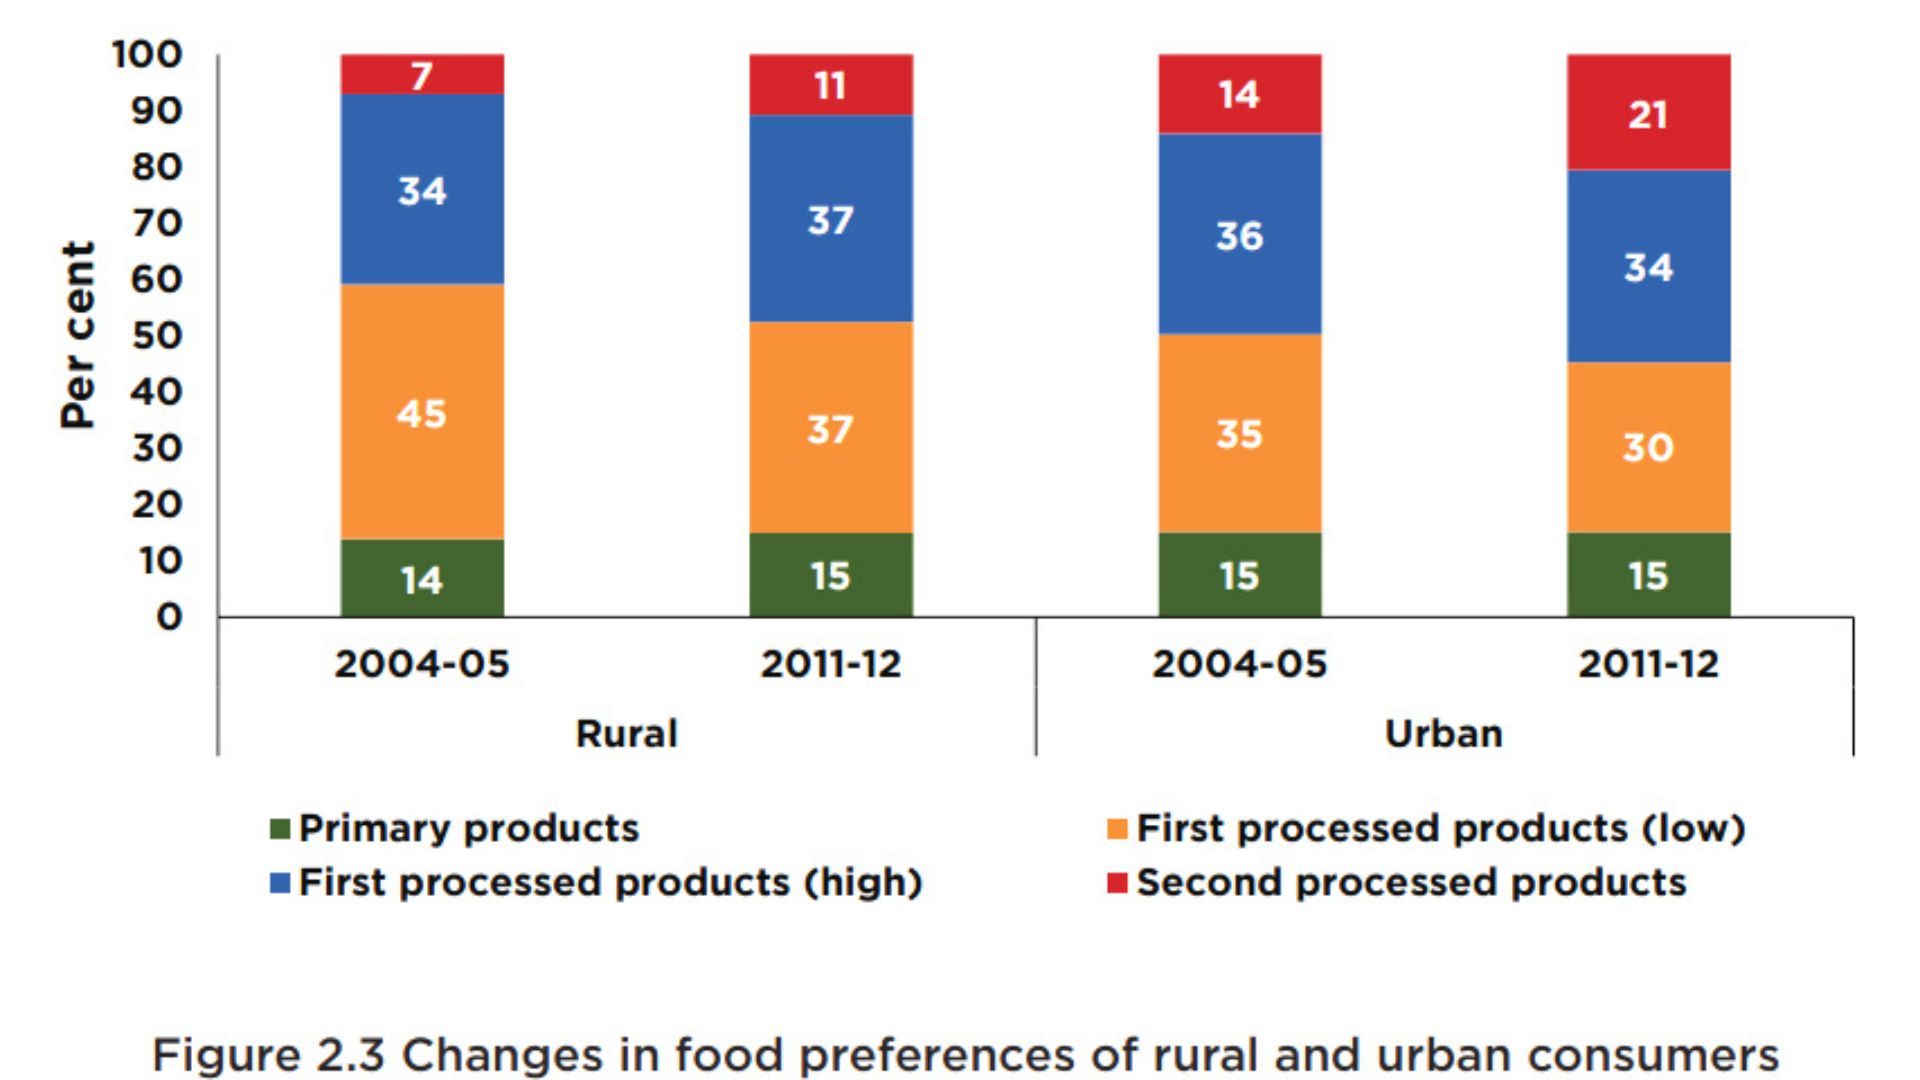
The other way to examine the change in food preferences is to analyze the change in the food basket in terms of consumption of foods based on the extent of value addition to them. Following Morisse and Kumar (2011), the food basket comprises (i) primary products, (ii) first-processed low value-added products, (iii) first-processed high value added products, and (iv) second-processed products.
• Primary products are consumed as produced without any processing (e.g. fresh fruits, vegetables, eggs, and fluid milk).
• First-processed low value-added products are the primary products with minimal level of processing (upto 5%), in terms of shelling, hulling, husking, milling, drying and grinding (e.g. rice, flour, pulses, spices, and dry fruits).
• First-processed high value-added products are the primary products that have undergone sophisticated processing in terms of pasteurization, heating, fermentation, slaughtering and crushing, adding 5-15% value to them but without any other ingredient (e.g. butter, curd, meat, fish, and sugar).
• Second-processed products are the products manufactured from the first processed products adding other ingredients such as flavors and preservatives (e.g. biscuits, bread, ghee, ice-cream, and jam).
Significant changes have taken place in the food basket. Cereals which accounted for about half of the total food expenditure in 1972-73, have gradually lost their share, declining to 22% in 2011-12 (Figure 2.2). On the other hand, the shares of high-added products, and an increase in the share of second-processed foods to 14% in 2011-12 from 9% in 2004-05. This indicates growing preference for second-processed food products, including the edible oils, fats, cold beverages, salted refreshments, cookies, cooked meals consumed outside home, etc. The real expenditure on primary foods has also increased, but the increment is far less than for the second-processed products.
Figure 2.3 presents the changes in food preferences of rural and urban consumers. The rural consumers allocated a higher share of food expenditure to the first-processed high value-added and second-processed foods in 2011-12 than in 2004-05. For urban consumers, the share of second-processed products increased from 14% in 2004-05 to 21% in 2011-12. These changes can be attributed to a sustained rise in per capita income, increasing participation of women in workforce, and changing lifestyles. Nevertheless, this transition in food preferences indicate existence of significant latent demand for high-value and processed foods.
Income is one of the key determinants of food consumption and dietary preferences. The data from the HCE surveys reveal a significant difference in the dietary preferences of consumers in different expenditure classes (Figure 2.4). The poor consumers spend proportionately more on first-processed low value-added foods than their rich counterparts. On the other hand, the share of first-processed high value-added, and second-processed foods is significantly higher for the rich consumers.
Nevertheless, share of second-processed foods has increased for all expenditure classes. The share of first-processed high value-added foods has increased but only upto seventh-decile expenditure classes. The dominance of high-value and processed foods in the food basket of the rich consumers indicates their strong positive association with household income.
HIGHLIGHTS
– The spending of Indian households is increasing over the years and a major part of incremental consumption expenditure is spent on non-food items. Allocation of household budget on food is declining.
– Consumer preferences are changing steadily away from staple to high value added and processed food products in both rural and urban areas and across all the expenditure-classes. This indicate existence of huge demand of these products and market for the food processing industry in the country.
– Rising consumer preferences towards high value food products have become more pronounced in the recent years. The estimates of consumption expenditure based on NSS-HCE surveys and NAS diverge in magnitude due to methodological differences, but both sources provide similar trends in consumption pattern.