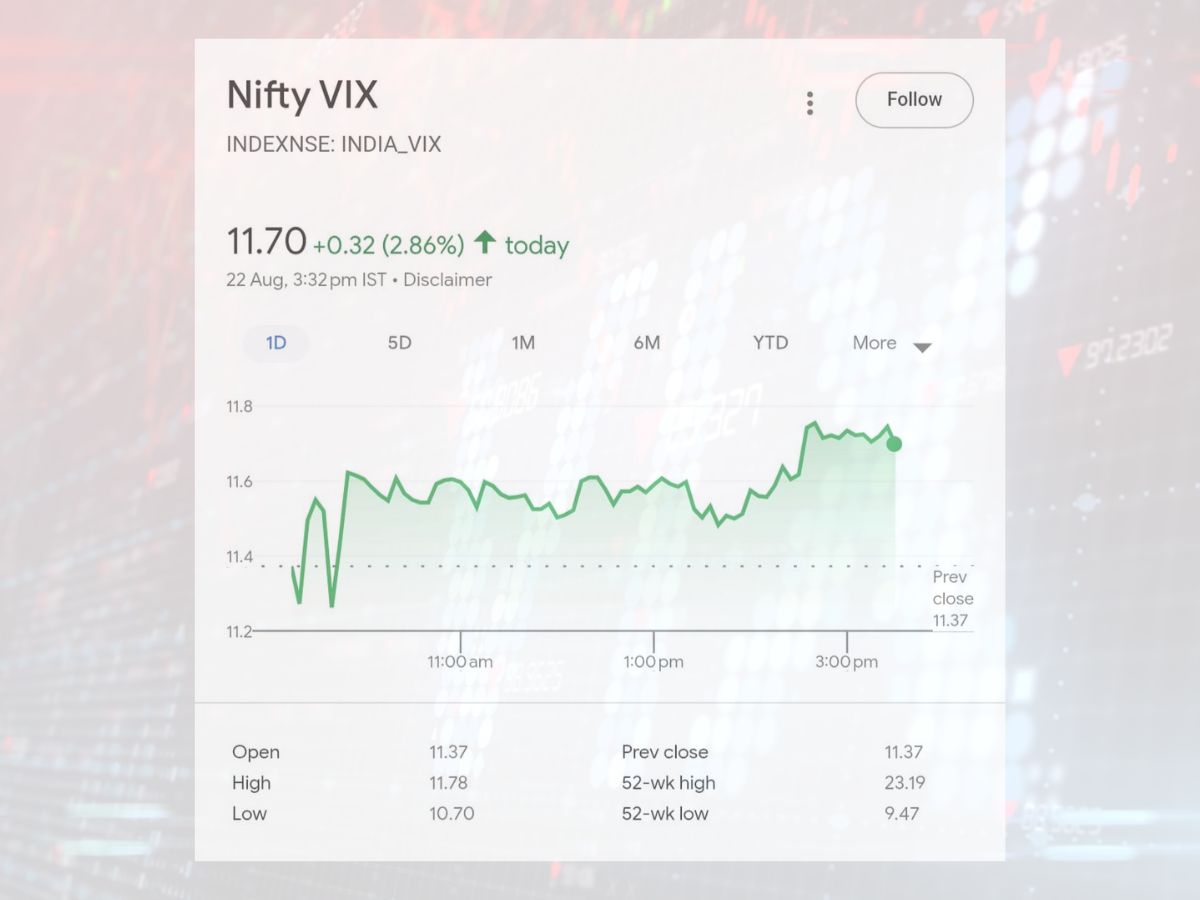
Volatility Index Nifty VIX aka India VIX acts as a display meter for volatility and the mood of the market and enables investors to accordingly plan their investments.
The Nifty VIX is commonly known as India VIX or India Volatility Index. It is an important indicator that reflects the expected volatility in the Indian stock market within a period of 30 days. Launched by the National Stock Exchange (NSE) of India, it provides an insight into how investors feel and the potential movement of the Nifty 50 index, the benchmark stock market index of India.
Nifty VIX indicates the market's expectation of volatility from the cost of Nifty options contracts. In contrast to stock price indexes like Nifty 50 or Sensex that monitor price movement of stocks, the VIX indicates implicit market risk and uncertainty levels. It is computed through complex mathematical models (based on the Black-Scholes option pricing model) that consider variables such as strike price, option premiums, time to expiry, and risk-free interest rate.
An elevated Nifty VIX value reflects anticipation of high price volatility and market uncertainty, usually observed when there is economic instability, geopolitical unrest, or an unexpected shock. On the other hand, a low VIX reading implies stability and peace with comparatively moderate price movements expected.
ALSO READ | Fed Rate Cut: A Double-edged Sword for the Indian Stock Market
Nifty VIX is a "fear gauge" for the Indian markets. As the investor becomes cautious, volatility increases and the VIX goes up significantly. Traders, portfolio managers, and retail investors track this index closely to assess market sentiment and risk appetite.
Historically, the Nifty VIX and the Nifty 50 index have an inverse correlation:
This inverse relationship is one of the main reasons volatility indices form a central part of full-picture market analysis.
ALSO READ | New Nifty Entries to Get Massive Inflows; Here are the Details
Under typical market conditions, India VIX is generally between 11 and 17. Low figures represent low volatility and complacent investors, while anything above 30-35 points to increased fear and uncertainty. Readings above 35 usually signal extreme bearishness or panic selling periods.
As an illustration, a VIX reading of 15 indicates that the market anticipates the Nifty to move within ±15% over the course of a month. This hypothetical band assists traders with risk planning and option pricing.
ALSO READ | Stock Recommendations : Brokerage firms Cautiously Make Their Calls
Nifty VIX is an important gauge that sums up market sentiment and perceptions of risk into a number. It allows traders and investors to make an informed choice by delivering an anticipatory measure of volatility. With the Indian markets dealing with global uncertainties, inflation concerns, and geopolitical developments, keeping an eye on Nifty VIX can provide valuable information about market sentiment and impending price movements. Knowledge and application of Nifty VIX efficiently enable investors to better predict volatility-led opportunities and threats, ultimately leading to more strategic and balanced investment strategies.